You grab a snack bar and spot 200 calories per serving. Sounds fine, right? But then you eat the whole thing, which has three servings, and suddenly it’s 600 calories. No wonder diets derail so fast.
Calories on food labels promise a clear energy snapshot. They estimate fuel from carbs, proteins, fats, and sometimes alcohol in one serving. Food makers use a basic formula: 4 calories per gram of carbs or protein, 9 for fat, and about 7 for alcohol. This Atwater system has guided labels for over a century. Yet confusion lingers because labels show potential energy, not what your body grabs.
People often chase low-calorie picks without checking portions or totals. This leads to surprises at day’s end. In this post, you’ll learn how companies crunch those numbers, smash common myths, see why labels differ from real absorption, and grasp FDA rules as of 2026. Ready to read labels like a pro?
How Food Companies Calculate Calories on Labels
Food companies start with lab tests or databases. They break down ingredients into carbs, proteins, fats, and alcohol. Then they apply the Atwater factors. Carbs and protein each give 4 calories per gram. Fat packs 9 calories per gram. Alcohol contributes roughly 7.
This method assumes complete breakdown. In reality, it’s an average. For example, a cereal lists 220 calories per cup serving. That comes from 40 grams carbs (160 cal), 5 grams protein (20 cal), and 4 grams fat (36 cal). Simple math adds up.
Packages often hold multiple servings. A bag might say 150 calories per serving but contain 10. If you finish it, multiply by 10 for 1,500 calories. Always check “servings per container.”
The % Daily Value (%DV) ties to a 2,000-calorie day. That 220-calorie serving hits 11% DV. But your needs differ. Active folks might aim for 2,500. Sedentary ones, 1,800. Use it as a rough guide.
For deeper details on the Atwater system, check reliable sources. It simplifies complex bomb calorimeter tests, where food burns fully.
The Role of Serving Sizes and % Daily Value
Serving sizes match what people eat now, thanks to FDA updates. A soda serving jumped from 8 to 12 ounces. Ice cream went from half cup to two-thirds. Chips dropped to 1 ounce.
Why? Data showed real habits. The FDA based changes on surveys. Now labels reflect packages better. Small ones under two servings count as one if eaten at once.
%DV helps compare foods. But it’s not your limit. A kid needs less than 2,000 calories. An athlete, more. So adjust mentally.
Take chips: one serving, 150 calories, 8% DV. Full bag? Ten servings, 1,500 calories, 75% DV. Surprise hits hard.
For official info, see the FDA on serving sizes.
Alcohol and Other Hidden Calorie Sources
Alcohol sneaks in drinks or extracts. It adds 7 calories per gram but rarely lists separate. A liqueur-filled chocolate? Those calories hide in totals.
Fiber doesn’t count fully. Labels subtract none, though. Polyols like sugar alcohols get partial credit, often 2 calories per gram. Organic acids contribute too.
Stick to totals. They capture everything.
Busting the Top Myths About Food Label Calories
Myth one: zero-fat means zero calories. Nope. Carbs and proteins fill the gap. A fat-free yogurt might pack 150 calories from sugar. Always scan total calories first.
Next, fat-free labels trick eyes. Shoppers grab them thinking light. But check carbs. They add up fast.
Myth two: serving size sets your portion. Wrong. It’s an average eat. You control intake. That “one serving” muffin? Often two in disguise.
People assume it’s advice. Instead, it baselines nutrition. Multiply for reality.
Myth three: %DV fits all. Not true. The 2,000-calorie base suits medium adults. Kids, elderly, or athletes need tweaks.
A high %DV alarms some. But context matters. Your day totals count more.
Myth four: sugar-free skips calories. Sugars swap for other carbs. Total stays similar.
Myth five: net carbs erase calories. Labels ignore “net.” Fiber subtracts for keto math, but calories include all.
Experts note these slips. One report lists common misreads. Bust them to eat smarter.
Myth: Zero Fat Means Zero Calories
Fat-free salad dressing? Still 100 calories from carbs. Protein adds too. Total rules.
Myth: Serving Size Is What You Should Eat
It’s typical, not ideal. Adjust to your plate.
Myth: Percent Daily Value Fits Everyone
Personalize it. Track your baseline.
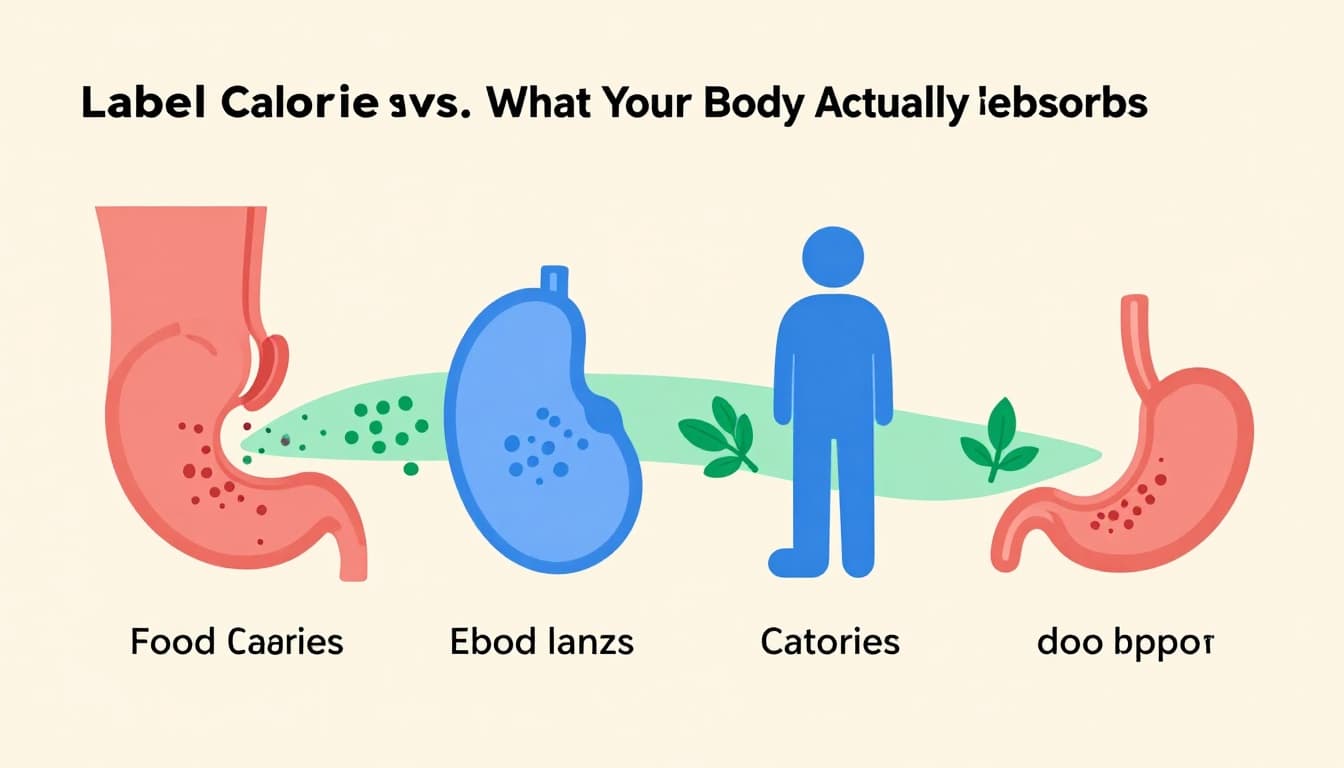
Label Calories vs. What Your Body Actually Absorbs
Labels show gross energy. Your body gets less. Digestion wastes 10-25%. Fiber passes through. Gut bacteria ferment some carbs.
Nuts label 170 calories per ounce. You absorb maybe 130. Cooking boosts availability. Raw veggies? Less uptake.
Proteins digest near full. Fats too. Plants vary. Studies confirm this gap.
No big 2025-2026 shifts. Labels stay fixed for ease. Use as guide. Whole foods shine here.
One piece explains why absorption varies.
Treat labels as estimates. Pair with hunger cues.
FDA Rules, Accuracy, and Latest Guidelines in 2026
Calories lead the label in bold font. Serving size follows, prominent. Rules from 2016 hold. No big 2026 overhauls.
“Calorie-free” means under 5 per serving. Over 50? “High calorie.” Accuracy? Within 20% usually. Variations from ingredients allowed.
FDA mandates dual columns for big packs. Shows per serving and whole. Helps spot totals.
Bigger fonts highlight calories since updates. Serving sizes match habits.
Check the FDA’s label changes page.
Trust labels, but weigh or app-check batches.
Labels use Atwater basics. They guide, not dictate.
Key Takeaways for Smarter Label Reading
Calories mean estimated energy per serving. Companies multiply macros simply. Myths fade when you check totals and servings. Your body absorbs less, so labels overestimate a bit. FDA keeps it standard in 2026.
Next time, scan servings per container first. Calculate package totals. Match to your calorie needs with apps. Focus on patterns over days.
Scan your pantry labels today. What surprises hide? Share in comments. Master this for real progress.